
No.
Note that I am NOT a political opponent of the current WH occupant. My disbelief of their numbers is NOT political. I am a mathematician and computer scientist with a good working knowledge of modeling, and I have constructed a standard epidemiological tracking and prediction model that says their data is bunk. I will give you access to it in a bit, and also to an independent model at Khan Academy, and show you how to run them for yourself. First, the WH briefing on April 31st:
- Claim was made that we’ll see a peak in 2 weeks. Publicly available models do not support the IHME model that Dr. Birx brought out to support this conclusion.

- Pence strongly intimated that lockdown would not be extended past the end of April. If cases don’t grow much faster (to build herd immunity) this will cause a disaster. There is some possibility people may disregard the lockdown to an extent and grow immunity, as the last few days data has come in over projections. I’ll show you how to track this for yourself. Peaking of cases in NY and Italy was a basis for models that support Pence’s timeline. NY had over 8000 new cases today, a 12% increase in their total cases. Not a peak. Italy case growth is slowing, but not peaking, and only because they remain in lockdown:

- Claim was made that the past two and next four weeks of lockdown will reduce deaths from about 2 million to under 200,000. ALL discussions of flattening give the purpose as keeping the peak caseload requirements under the number of available ventilators. Flattening does NOT reduce the number of people who eventually get sick. Therefore with 1% mortality and 200 million eventually sick, the 2 million are likely to die. Mortality may be less, perhaps as low as a quarter of a percent. We’ll see when we get enough testing to identify the milder cases.

Here are the last 14 days in the US, from https://www.worldometers.info/coronavirus/country/us/
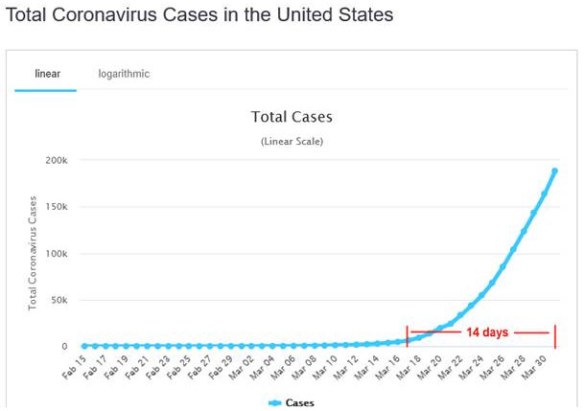
Do you see a peak coming in the next 14 days?
The most widely accepted epidemiology models are called SIR models (susceptible, infected and recovered), and they are very simple.
The most important parameter is the reproductive rate. The natural rate is called R0 (pronounced R-naught). It is the number of new cases for every case you have. R0 does not tell you how fast this happens. There are other factors for that.
Once people have the illness and develop immunity, some of the would-be transmissions of the virus encounter people already immune. This reduces R0. If the percentage of people who have had the disease and acquired immunity is H = R/population (recovered/population) then the effective reproduction rate R0′ = R0(1-H). When R0′<1 the disease stops propagating and dies.
R0 for COVID-19 is 3.28. Don’t believe lower numbers from WHO. This is a peer reviewed number. I’ll tell you how to check it in a moment. Then H=1-1/R0=70%. That’s how many of us have to get it, over 200 million.
Go to Khan Academy’s simulator here: https://www.khanacademy.org/computer-programming/modelling-an-epidemic/6131690633428992 . Put in these values:

The important thing is to get R0 about right. The max population in this simulator is 100 million, so I scaled the US population by a factor of 10. I scaled the initial infections from 5000 on about March 16 to 500. The time should not need scaling. Here is the result. This would correspond to the natural disease progress if we did NOT lock down:

The peak cases (red line) comes 70 days after the start, which was March 16. That is the end of May, not the middle of April as Birx and Pence alleged.
I think likely Trump and Pence are taking their advisor’s words for it. Why their advisors would commit this error I do not know. Surely they are not so incompetent?
However, Fauci and Birx are both immunologists, vaccine people, not epidemiologists. Not modelers and computer scientists. There is a conflict of interest there, consciously or unconsciously. They, and Trump since he picked them, would like to see a vaccine success. They have to put the pandemic off for a year for the vaccine to be ready. The economy has to be shut down to do that. Trump is infatuated with borrowing money at 0% interest to patch things together meanwhile. This is a recipe for disaster. Recent diseases like Zika have damped out on their own before a vaccine was ready. Our best hope is people ignore the lockdown to some extent. If it is only 60% effective, we’ll get enough herd immunity to unlock on May 1 without exceeding ventilator capacity. Just barely. Or the rest of the world may obtain immunity and go back to business as usual. Time will tell. I’d rather have a plan.
The effective R0 I have observed in the last 10 days of data, after lockdown, is about R0=1.23. This is much lower than 3.28. It leads to a very slow, long process, like this in the Khan Academy model:

The red line, which you can barely see this is so flattened, peaks after 400 days. May of 2021! And still it’s not over. Here is what happens if you unlock too early. Here is also what I’m advocating, which is a partial unlock NOW, a few days a week, so more people get sick, but not so many as to overload hospitals, and our herd immunity rises:

Now you are ready to go to my site for more information http://shulerresearch.org/covid19.htm . You can download my spreadsheet, which has some features to implement the partial unlock which the Khan Academy model doesn’t have. There is also a user guide for my spreadsheet (with the extra options, it’s a little complicated).
It has a link to a scientific paper I’ve sent for peer review. In that paper you can find references for R0=3.28 and all the other parameters I use.
Please contact your representatives in government or any influential people you know, if you are concerned about this as I am. Use the contact link above if you need my assistance. This may be the most important message I have ever written. Good luck to you and your loved ones!
Robert Shuler
